
Why Shouldn’t a New Application Be a 1:1 Copy of Excel?
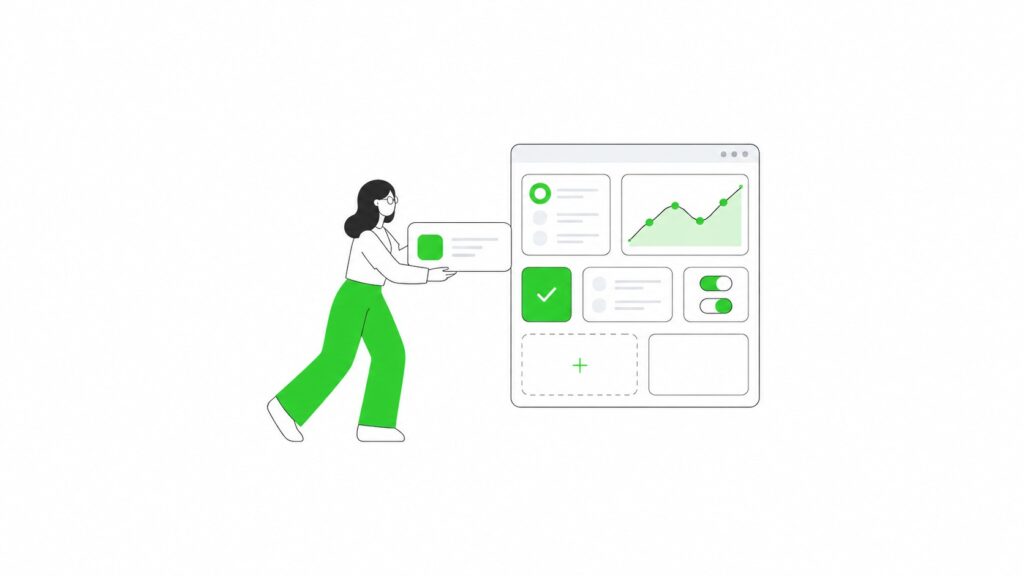
In many companies, the decision to build an application starts with a specific file. There is a spreadsheet that has been developed, expanded, corrected, and adapted to the team’s everyday work over the years. It contains data, formulas, statuses, comments, colors, manual adjustments, reports, and several tabs whose meaning is understood by only a few people.
The natural request is then: “we want to move this Excel spreadsheet into a system.”
That is understandable. The spreadsheet is familiar, has worked for a long time, and reflects how the company actually operates. The problem is that an application designed as a 1:1 copy of Excel very often reproduces its limitations. Instead of organizing the process, it turns the file into an inconvenient online form. Instead of reducing the number of exceptions, it preserves them in a new tool. Instead of improving control, it creates a digital version of the same chaos.
That is why Excel is a very good starting point for analysis. It should not, however, be treated as a ready-made application design.
A More Expensive Excel Is Still Excel
If a new application only recreates the old columns, colors, comments, and manual workarounds, the company will not solve the problem. It will get the same chaos — only in a more expensive tool.
Excel Has a Cell-Based Layout; an Application Should Have a Process-Based Layout
Excel organizes information into cells, columns, rows, and tabs. This is an excellent approach for analyses, summaries, calculations, and working data. A user can quickly add a column, change a formula, copy a data range, or prepare their own view.
An application works differently. Its purpose is not only to store information in a table. A well-designed application should guide the user through a process.
In Excel, the user sees a large table and knows what to do next. In an application, they should see the right screen, the right fields, the right actions, and the right restrictions resulting from their role. A salesperson does not need to see every technical column. A manager does not need to edit source data if their task is approval. A person responsible for reporting should not have to manually check whether someone completed the required fields
Example: a spreadsheet used for quoting may contain dozens of columns: customer, product, discount, margin, status, comment, sent date, responsible person, cost, quote version, management comments, approval date. In Excel, all of this sits side by side. In an application, a better solution may be to divide it into: customer record, quote form, calculation, margin approval, change history, and performance report.
This is not a cosmetic difference. It is a shift from a “data table” layout to a “process with roles and decisions” layout.
Not Every Column Is a Business Requirement
One of the most important stages of analysis is distinguishing real requirements from workarounds that arose only because the spreadsheet had its limitations.
Company spreadsheets often contain columns that do not describe the process but help people handle it manually. For example:
- a “to be checked” column because there is no formal status,
- a “note” column because there is no place for comments and decision history,
- a “version” column because the file is copied and sent between people,
- a “sent?” column because there is no automatic notification,
- an “old status” column because someone has to manually monitor the change,
- a “manually corrected” column because the formula does not handle exceptions.
When such a column is moved into an application without analysis, there is a risk that the system will require the user to manually enter information that should follow from the process automatically.
If the user has to mark that a case has been sent, perhaps the application should record that automatically after the message is sent. If someone manually enters the approval date, perhaps the system should save it automatically when “approve” is clicked. If a column is used to mark exceptions, you need to determine what those exceptions are and whether they can be handled with a rule, a status, or a separate process path.
So the question is not: “which columns should be included in the application?” A better question is: “why does this column exist and what business need does it serve?”
Do You Have an Excel Spreadsheet That Nobody Wants to Touch Anymore?
This is often a sign that the spreadsheet has become too important, too complex, or too risky to continue operating in its current form.
Show us your file. We will check whether it should be organized, automated, turned into a dashboard, or moved into an application.
A Cell Color Is Not a Process Status
In Excel, the meaning of data very often comes not only from the values in cells, but also from formatting. A color indicates urgency, bold text indicates approval, strikethrough indicates cancellation, and a red background indicates a problem.
For someone who works with the file every day, this may be clear. For an application, however, this representation is too informal.
If a color represents a status, the status needs a name. If a red background indicates an error, the error rule needs to be defined. If a yellow field means “waiting for a decision,” you need to determine who makes that decision, by when, and what happens after it is made.
In an application, status should be part of the process, not decoration applied to data. It should affect available actions, information visibility, notifications, reports, and accountability.
Example:
in an order spreadsheet, blue means “to be prepared,” yellow means “waiting for the customer,” green means “ready,” and red means “problem.” In an application, these colors can be replaced with explicit statuses. This makes it possible to filter cases by status, send notifications, measure time spent at each stage, and identify where the process most often gets blocked.
This is the value of an application. Not simply moving colors from the spreadsheet, but turning informal markings into a controlled process.
If a Color in Excel Represents a Decision, It Is Worth Naming It
A red field, yellow background, or green cell often means something important: a problem, approval, delay, or completed stage. In an application, this information should not depend on whether someone remembers what the colors mean. It should be clear to every user and visible in reports.
Łukasz Rompca
owner of evolabs.dev
A Form Should Not Be a Long Table to Fill In
A common mistake when designing an application based on Excel is turning every spreadsheet column into a field in one large form.
Technically, this can be done. From a business perspective, it often makes little sense.
The user gets a screen with dozens of fields, some of which are irrelevant to their role, some are needed only later, some should be calculated automatically, and some result from data in other modules. Such an application quickly becomes burdensome. Users start skipping fields, entering working notes, creating their own shortcuts, or returning to Excel because “it was faster there.”
A better approach is to determine who needs a given piece of information and when.
Some fields are needed at the beginning of the process. Others only at the approval stage. Some are visible only to accounting. Some should be visible to management but not editable. Some should come from a price list, dictionary, integration, or earlier selection.
A well-designed application does not show everything to everyone. It shows what is needed to complete a specific step.
Data, Rules, and Reports Need to Be Separated
In Excel, data, rules, and reports often live in the same place. One tab contains source data, another formulas, a third a summary, a fourth corrections, and a fifth a report for management. Sometimes these layers are mixed even more: some formulas sit next to the data, while a report is created by manually filtering and copying ranges.
In an application, these elements should be separated.
Data is information that describes business reality: customer, order, quote, cost, project, employee, contract, product, status. Rules define how the process works: what can be edited, when approval is required, how margin is calculated, when to send a notification, what counts as an error, and which fields are mandatory. Reports define how data is presented: views, summaries, metrics, filters, exports, and comparisons.
How Much Does Manual Data Copying Between Excel, CRM, and ERP Cost?
In companies using several tools at the same time, Excel very often becomes the place where data is combined manually. Information comes from CRM, ERP, an invoicing system, an online store, forms, emails, CSV files, or other spreadsheets. Someone has to download it, paste it, align it, fill in missing fields, and check that everything matches.
In companies using several tools at the same time, Excel very often becomes the place where data is combined manually. Information comes from CRM, ERP, an invoicing system, an online store, forms, emails, CSV files, or other spreadsheets. Someone has to download it, paste it, align it, fill in missing fields, and check that everything matches.
This work is expensive for several reasons. First, it takes time. Second, it is prone to mistakes: it is enough to paste data into the wrong place, omit part of a table, or miss a change in an export format. Third, it is difficult to control. If the result of a report depends on a dozen manual steps, the company has to trust that each one was performed correctly.
If these three layers are mixed together, the application can become difficult to develop. Every report change will look like a data change. Every rule change will require checking multiple screens. Every exception will be added as another field.
Separating data, rules, and reports provides greater control. It allows the process to evolve without rebuilding the entire tool. It also makes it easier to answer what really needs to be built and what is only a way of presenting information.

Change History Should Not Be a Comment in a Cell
In spreadsheets, comments often act as the memory of the process. Someone adds why they changed a value. Someone notes that the customer requested a correction. Someone enters the reason for rejection. Someone else adds an update after a phone call.
This works as long as the process is simple and handled by a small team. With more people involved, comments quickly stop being enough.
An application should record change history in a structured way: who changed the data, when, from which value to which value, what status the case was in, and what action was performed. The user does not always need to see the full technical audit log, but the system should make it possible to reconstruct what happened.
This matters not only when errors occur. Change history helps analyze the process. It shows where delays occur, which decisions are reversed, which exceptions happen most often, and which stages need clarification.
This is another example of the difference between a spreadsheet copy and a system. A spreadsheet copy gives you a place for a comment. A system provides accountability and a decision trail.
An Application Should Reduce Errors, Not Just Store Them
If Excel allows any value to be entered, users often enter data in different formats. The same status may have several names. A date may be entered as text. A customer name may appear in several versions. Amounts may be entered in different currencies or without tax. Some fields may be empty even though a later report assumes that they are populated.
Moving this structure 1:1 into an application does not solve the problem. An application should introduce validations and restrictions where they make business sense.
The goal is not to make users’ work more difficult. The goal is for the system to help them enter data correctly from the very beginning of the process. A selection list instead of free text. A required field where missing data blocks the next stage. Automatic value validation if exceeding a threshold requires approval. A message when the user tries to perform an action without the required information.
This means the company does not have to manually correct the data later before reporting. Data quality is created during the process, not only at the end.
Spreadsheet Errors Are More Common Than They Seem
One frequently cited summary of research on spreadsheets used in companies indicated that 94% of the spreadsheets analyzed contained errors.
In a simple summary, this may be a minor issue. In a spreadsheet used for quotes, budgets, reports, or work planning — it becomes a risk of costly decisions.
Source: Powell, Baker, Lawson, Errors in Operational Spreadsheets.
(https://mba.tuck.dartmouth.edu/spreadsheet/product_pubs_files/errors.pdf?utm_source=chatgpt.com)
Not Everything from Excel Needs to Be Included in the First Version of the System
Spreadsheets developed over many years often contain many elements that are used rarely, historically, or only by individual people. When designing a new solution, it is easy to assume that everything must be moved immediately.
This usually increases cost, extends the project, and complicates the first version.
A better approach is to determine which elements are critical to the process, which are needed later, and which can remain outside the system or be handled differently. Some reports can be exports. Some fields can be moved to a later stage. Some manual corrections may become unnecessary once the rules are organized. Some tabs may be nothing more than an archive.
The first version of the system should solve the most important business problem, not reproduce the entire history of the spreadsheet.
Before You Build a System, Calculate the Cost of the Current Way of Working
If the team still manually corrects data, checks file versions, searches for errors, and prepares reports, the company is already bearing a cost — even if Excel itself appears to be free.
When Is It Worth Keeping Some Similarity to Excel?
The point is not to completely ignore the existing way of working. The spreadsheet is an important reference point because users know its logic, names, data layout, and way of thinking.
In some places, similarity to Excel can help. This applies especially to tabular views, exports, simple summaries, bulk data editing, or operational reports. If a team has worked with a table for years, it is not always worth replacing it entirely with cards and forms.
The difference is that similarity should be a conscious design decision, not the default assumption.
You can keep a tabular data view while introducing roles, validations, statuses, change history, and process control. You can allow exports to Excel without treating the file as the primary source of truth. You can show users familiar field names while organizing them into logical sections.
The goal is not to abandon Excel at any cost. The goal is to remove the elements that make the process difficult to control and develop.
When Is It Worth Keeping Some Similarity to Excel?
Before designing the system, it is worth going through a few control questions.
-
1. Does a given column describe real business information, or is it only a workaround?
If the column exists so that someone can manually monitor something the system could perform automatically, it should not be transferred directly. -
2. Who needs this information and at which stage?
If a field is used by only one role, it does not have to be visible to all users. -
3. Should a given value be entered manually, selected from a list, or calculated?
This simple question often reveals many places where an application can reduce the number of errors. -
4. Does a color, comment, or filter represent a hidden process status?
If so, the status needs to be named and the actions associated with it need to be defined. -
5. Does the report use source data or a manually prepared summary?
If the report requires many manual steps, the problem may not be the report itself but the lack of a structured data model. -
6. Is this element needed in the first version?
Not every spreadsheet function needs to be included in the first stage. Some can wait if they do not affect the core process. -
7. What should change once we are no longer limited by Excel’s structure?
This is one of the most important questions. The new tool does not have to inherit all the limitations of the file.
You Do Not Need to Be an Application Specialist
All you need to do is show us the spreadsheet that is causing problems today. We will check what can be done with it, how much the change may cost, and whether such an investment makes sense for your company.
Process Logic First, System Design Second
A good application is not created by copying a spreadsheet into forms. It is created by understanding how the company works and how it should work once the process is organized.
Excel reveals a great deal: data, exceptions, manual activities, reports, calculations, and places where users had to create workarounds. This is valuable analytical material, but it needs to be interpreted.
First, it is worth naming the process. Then define the roles, data, statuses, decisions, rules, exceptions, and reports. Only after that should you design screens, forms, automations, dashboards, or an application.
Sometimes such an analysis will show that a full application is not needed. It may be enough to organize the spreadsheet, add automation, create a dashboard, or implement a simpler workflow. In other cases, the analysis will show that the spreadsheet has long been supporting a process that requires a more stable system.
In both cases, the decision is better because it follows from the logic of the process rather than the layout of the existing file.

Less Manual Reporting, Faster Access to Data
For a logistics company, EvoLabs created a system that brought operational data into one place and gave management up-to-date visibility into key information.
Instead of manually assembling reports from multiple sources, the company can check data faster and make decisions based on current information.
Summary
Excel can be a very good starting point. It is often the first version of a process, documentation of exceptions, and a practical record of how the company actually works. However, it should not automatically become the application design.
An application copied 1:1 from Excel can reproduce the very problems it was supposed to solve: too many fields, unclear statuses, manual workarounds, lack of accountability, mixing data with reports, and the need to perform activities that the system should handle itself.
That is why, before designing the solution, data, rules, and reports need to be separated. You need to determine which columns are actual requirements and which are only traces of the previous way of working. Roles, statuses, validations, exceptions, and change history need to be defined.
The goal is not to create “Excel in a browser.” The goal is to improve the process.
{Read the next articles in the series
“From Excel to Application”}
7 Signs Your Business Has Outgrown Excel
How Much Does Excel Really Cost a Business?
An Application Instead of Excel — When Does It Make Sense, and When Does It Not?
How to Move from Excel to an Application: A Step-by-Step Process
Why Shouldn’t an Application Be a 1:1 Copy of Excel?
First We Organize the Logic, Then We Design the System
At EvoLabs, we help companies look at a spreadsheet as a business process, not just a file to be copied.
We analyze data, user roles, rules, statuses, reports, exceptions, and the places where the current way of working requires manual control. Only after organizing these elements can you consciously decide whether improving the spreadsheet, automation, a dashboard, a workflow, or a dedicated application is the best direction.
If an important process in your company currently runs in Excel or Google Sheets, it is worth starting by analyzing its logic.